
Where did that AWS network bill come from?
Trace a private subnet’s traffic to find out which charges come from NAT processing, cross-zone paths, and the destination itself.
Start with the invoice and the route table
A private worker pool begins copying larger batches of files, and the network line on the AWS bill rises. Before changing the design, pin down the account, region, and billing period. Separate NAT gateway hours from bytes processed, and look for regional transfer and internet transfer charges alongside them.
Use billing data to locate the change and subnet route tables to establish where traffic can go. NAT CloudWatch metrics show traffic volume. VPC Flow Logs can help identify which sources and destinations account for it. Compare the same time window across these views.
Follow a large transfer from the worker
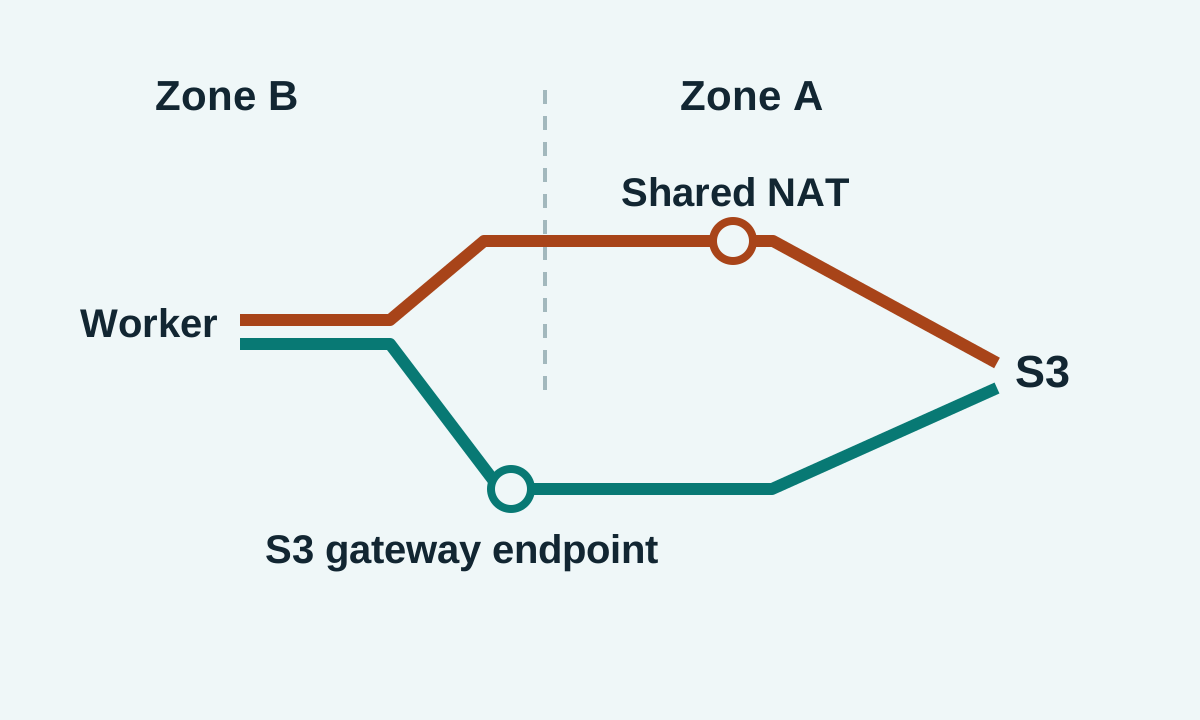
Consider a worker in Zone B that sends traffic through a public NAT gateway in Zone A. For a request to a supported AWS service, that path can incur NAT processing and cross-zone transfer charges. Other destinations can bring different charges. Write down the source, destination, zones, and route for each major flow before estimating savings.
A useful first comparison is eligible same-region S3 traffic versus all other outbound traffic. They may share a gateway today, but an S3 gateway endpoint can change the path for the first group only.
Build a traffic ledger before pricing alternatives
Start with three rows for the worker: same-region S3 uploads, calls to an external API, and any traffic you cannot yet classify. For each row, record the subnet, destination, likely path, estimated monthly volume, and the evidence you used. That keeps a busy NAT gateway from becoming a catch-all explanation for every transfer line.
Use a small representative interval to connect flow records to known workload activity. An S3 batch job and an external API can run at the same time. A spike in gateway traffic alone tells you when bytes moved, but it cannot tell you which application generated them.
Treat the ledger as a diagnostic aid. Reconcile its estimated volumes with billing usage and keep unexplained differences visible. Flow records, NAT counters, and billing exports describe traffic at different points, so their totals can differ.
Estimate the charges you would actually remove
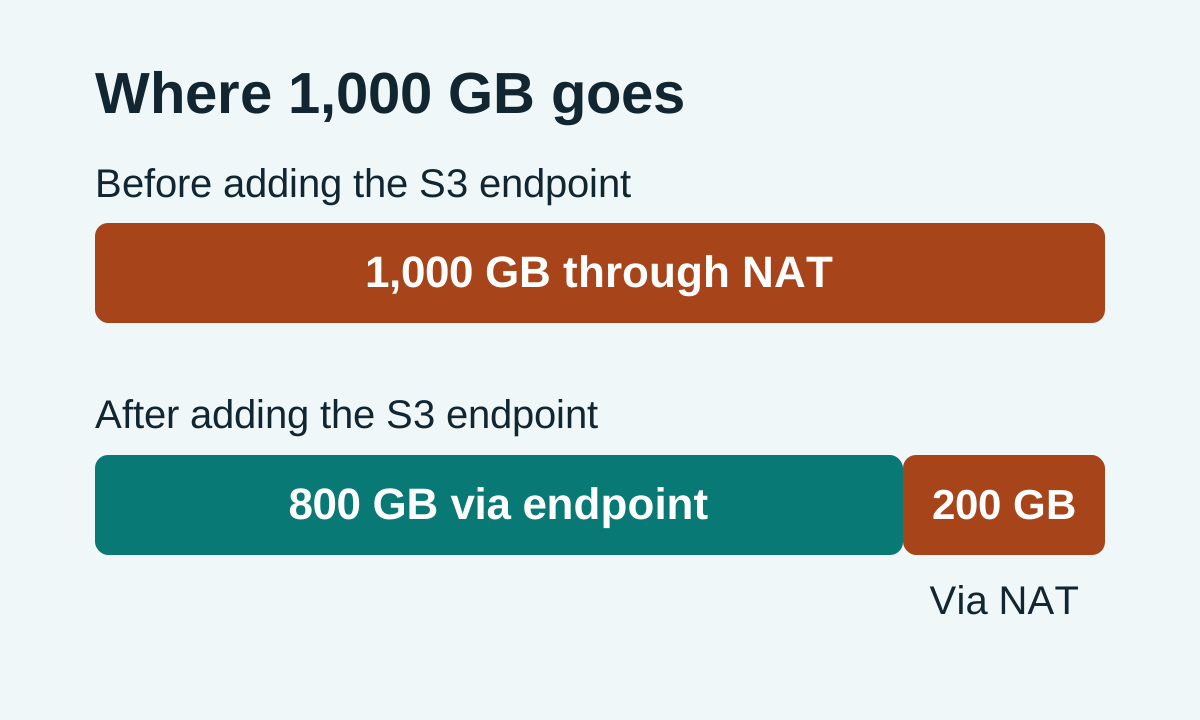
Suppose 800 GB of monthly NAT-processed traffic belongs to eligible S3 transfers. Multiply those bytes by your regional NAT processing rate to estimate that part of the avoided cost. Estimate any avoided cross-zone transfer separately from observed traffic and applicable rates. If the gateway still handles other destinations, its hourly charge stays in the comparison.
AWS does not add an hourly or processing charge for an S3 gateway endpoint. Interface endpoints have their own pricing, so model their hours and processing separately. For remaining outbound traffic, compare the cost of adding zone-local NAT capacity with the cross-zone charges it would avoid. Keep the availability requirements in that comparison.
Compare two changes against the same baseline
Imagine the gateway processes 1,000 GB in a month. If the ledger attributes 800 GB to eligible S3 traffic, an endpoint could leave about 200 GB on the NAT path, assuming traffic stays the same. A second NAT gateway would solve a different problem: it could remove a zone crossing for the remaining traffic, while adding fixed gateway cost.
Use separate rows for the current design, the endpoint alone, and the endpoint plus zone-local NAT. Price each row using the rates for your region and include any other charges that change with the route. Avoid counting a cross-zone charge again if the endpoint option already removed it.
For a rough break-even check on the extra gateway, divide its incremental monthly fixed cost by the effective cross-zone charge avoided per GB. Use observed billable directions when estimating that effective rate. If the proposal also changes availability or security controls, review those implications independently of the cost comparison.
Pilot on one route table
Choose one workload whose S3 access you can test. Check region, endpoint policy, bucket policy, and route table associations. A route change can interrupt open connections, so pick a change window and verify that the worker retries safely.
Compare NAT traffic and billing usage after the change, accounting for how many files the worker processed. Confirm that external dependencies still work and that access controls behave as expected. Expand the change only after the observed path and bill agree.