
Cut BigQuery scan costs on dashboards people use every day
Find the recurring dashboard queries that scan the most data, narrow them without changing their answers, and put a budget on future scans.

Find the refreshes that matter
A daily orders chart might show thirty rows and still scan a large event table on every refresh. For an on-demand BigQuery project, start with the jobs behind the dashboard. Over a normal business week, group them by dashboard label where available, or by a repeatable query pattern, and rank them by total bytes billed.
Separate cache hits and one-off jobs when interpreting the results. A frequently refreshed chart can outweigh a larger query that rarely runs. This workflow targets on-demand analysis charges. For capacity pricing, investigate slot consumption and contention alongside bytes processed.
Measure a week of refreshes before rewriting SQL
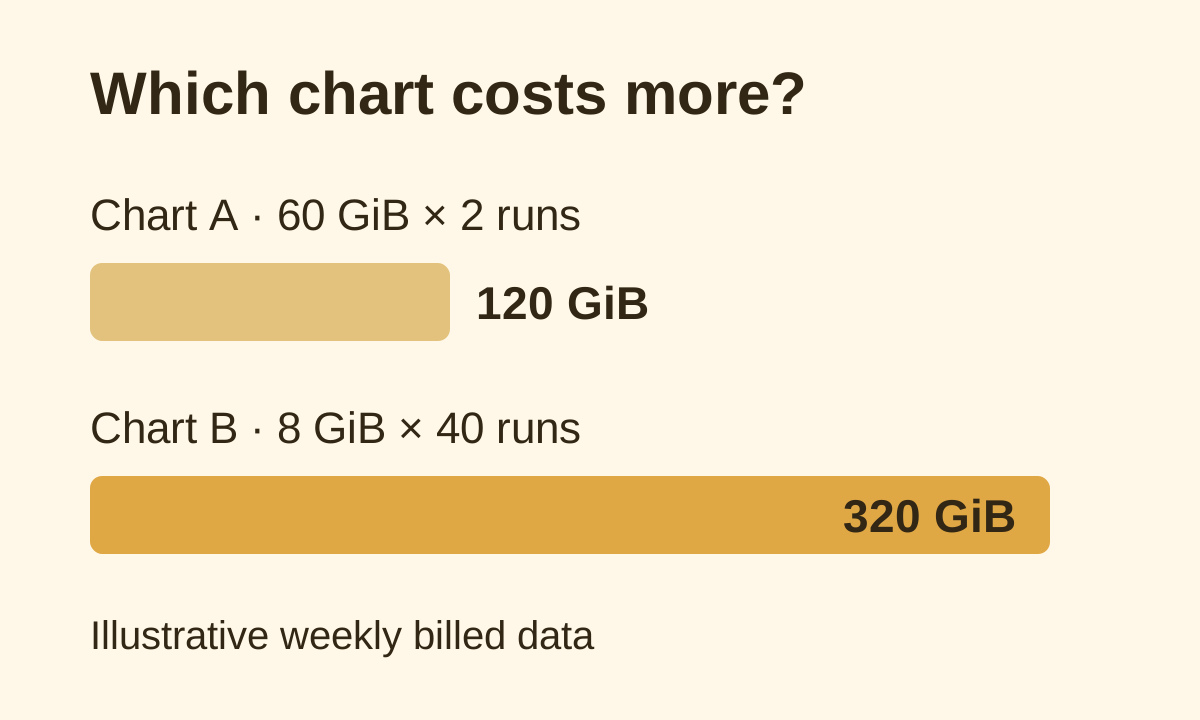
A query that bills 60 GiB and runs twice a week accounts for 120 GiB. A chart that bills 8 GiB and runs 40 times accounts for 320 GiB. In this illustrative dashboard, the smaller query is the better first candidate. Use billed bytes and run count together so a single large query does not dominate the investigation.
For each candidate, record the dashboard and chart owner, date range, run count, bytes billed, and whether results were cached. Use job labels if your client supplies them. If labels are missing, check query patterns with the owner before attributing a shared query to one dashboard.
Keep the example parameter sets alongside the job IDs. Include the default window, the longest window users can select, and a store filter that returns few rows. The same rewrite can behave differently across those cases.
Reduce the data the query has to touch
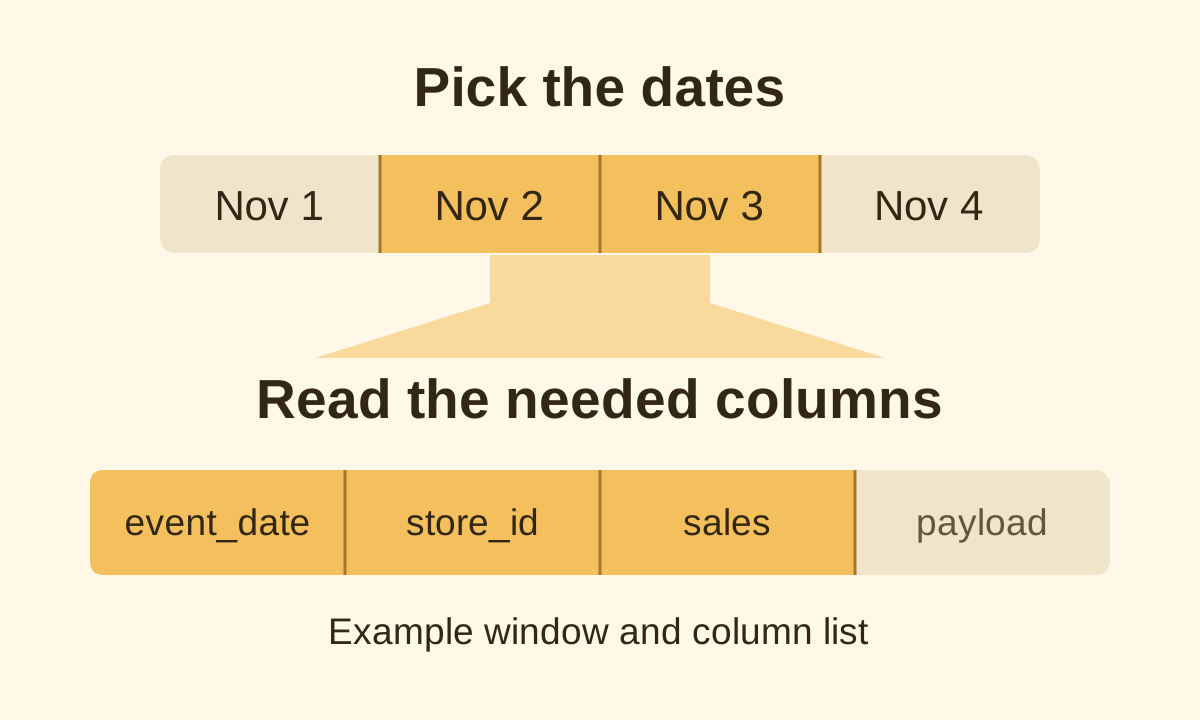
Consider a dashboard showing thirty calendar days of sales from a table partitioned by event_date. Filter directly on that partition column with the intended date window, and select only the columns needed for the aggregate. Check the business time zone before replacing the existing filter so the same transactions count on the same dates.
If the table is also clustered by store_id, a selective store filter can let BigQuery skip storage blocks outside the filter. A dashboard that always queries all stores is a weaker candidate for that clustering key. A LIMIT on the result controls returned rows and does not by itself reduce bytes read from a non-clustered table.
Keep the date window explicit
For a chart showing November 1 through November 30, a half-open range includes November 1 and stops before December 1. If event_date is the partitioning column and already represents the dashboard’s business date, apply those two bounds directly to event_date. Verify that the chart’s definition of a day matches the date stored in the table.
Check a few records near midnight before rollout. If the original SQL converts timestamps to a local date while the partition column is derived in UTC, a direct substitution can shift transactions between days. In that case, keep the business-date logic and work out a partition filter that covers every date the original query can read.
Compare the same store and date buckets in the output. Include dates with no orders and a day with late-arriving data. Confirm whether the dashboard should display empty dates as zero, omit them, or show missing data.
Replay the query and compare like for like
Dry-run the original and rewritten SQL with representative dashboard parameters. Treat the estimate for clustered tables as an upper bound where BigQuery cannot determine block pruning in advance. Compare actual job statistics after a controlled run, accounting for query cache behavior.
For an illustrative comparison, suppose a refresh drops from 120 GiB billed to 12 GiB billed. At 20 identical uncached refreshes, that is about 2.11 TiB less billed data, before pricing adjustments. Compare totals and chart rows as well as bytes, especially for late-arriving events, empty dates, and date boundaries.
Put a guardrail on the dashboard
Set a maximum bytes billed value where your on-demand query client supports it. BigQuery can reject a query when its estimate exceeds the cap, so test the cap with the widest allowed date range. Leave room for estimated bytes on clustered tables and give the dashboard owner a way to spot failed refreshes.
If many charts repeatedly calculate the same aggregate, compare a scheduled summary table against the raw query. Include the cost of building and refreshing the summary, and decide how the dashboard should show stale data if the job fails.