
Right-size Kubernetes pods without slowing down your app
A worked example shows how a smaller CPU request can trigger more replicas, and how to test whether a change really frees cluster capacity.

The pod looks oversized. What would you change?
Imagine an image-processing API whose containers request 500 millicores each. Most of the day the pods look quiet, but a morning import runs alongside customer requests. Reducing the request from an average CPU chart could make the deployment cheaper, busier, or simply different. First, work out which of those outcomes your change can actually produce.
The numbers below are illustrative. Use your own workload measurements to pick candidates and your service objectives to decide whether to keep a change.
Separate scheduling, limits, and service health
Kubernetes uses requests to decide where pods fit. CPU limits can throttle a container, while hitting a memory limit can lead to an out-of-memory kill. A low CPU request is a scheduling choice. Changing a CPU limit changes how much CPU the container can use before it is throttled.
Look at a full demand cycle, including starts, bursts, and recurring jobs. Compare CPU usage with throttling and request latency. For memory, inspect peaks and restart reasons as well as normal usage. Measure per container so a sidecar does not hide what the app itself needs.
Build a baseline you can replay
Record traffic and work per replica before interpreting CPU. For the image API, requests per second alone misses an important distinction: thumbnails and full-resolution images may require very different amounts of work. Keep the mix of image sizes and the timing of the import comparable when you replay the load.
Capture the baseline in three windows: steady traffic, the import peak, and the first minutes after a restart. For each window, record CPU and memory by container, ready replica count, throughput, errors, and tail latency. Keep the deployment settings and node count alongside those measurements so another engineer can reproduce the comparison.
If you see a burst in latency, check where time went before changing the resource settings. A backlog in the worker queue, a slow object-store read, and CPU throttling can all leave the request handler looking slow. Pick a metric that can distinguish the suspected cause.
Do the autoscaler math before changing the request
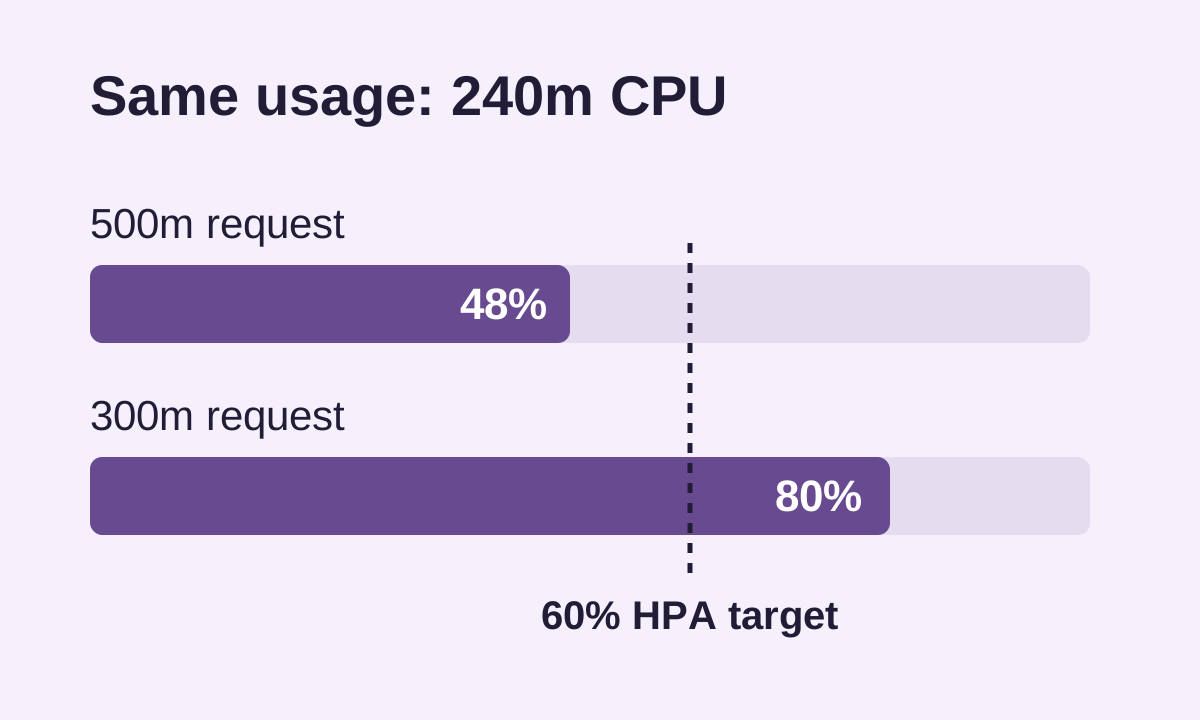
Suppose each pod uses 240 millicores at the load you are testing. At a 500-millicore request, that is 48% utilization. At 300 millicores, the same CPU use is 80%. If a Horizontal Pod Autoscaler targets 60% CPU utilization, the smaller request changes the signal even when traffic stays the same.
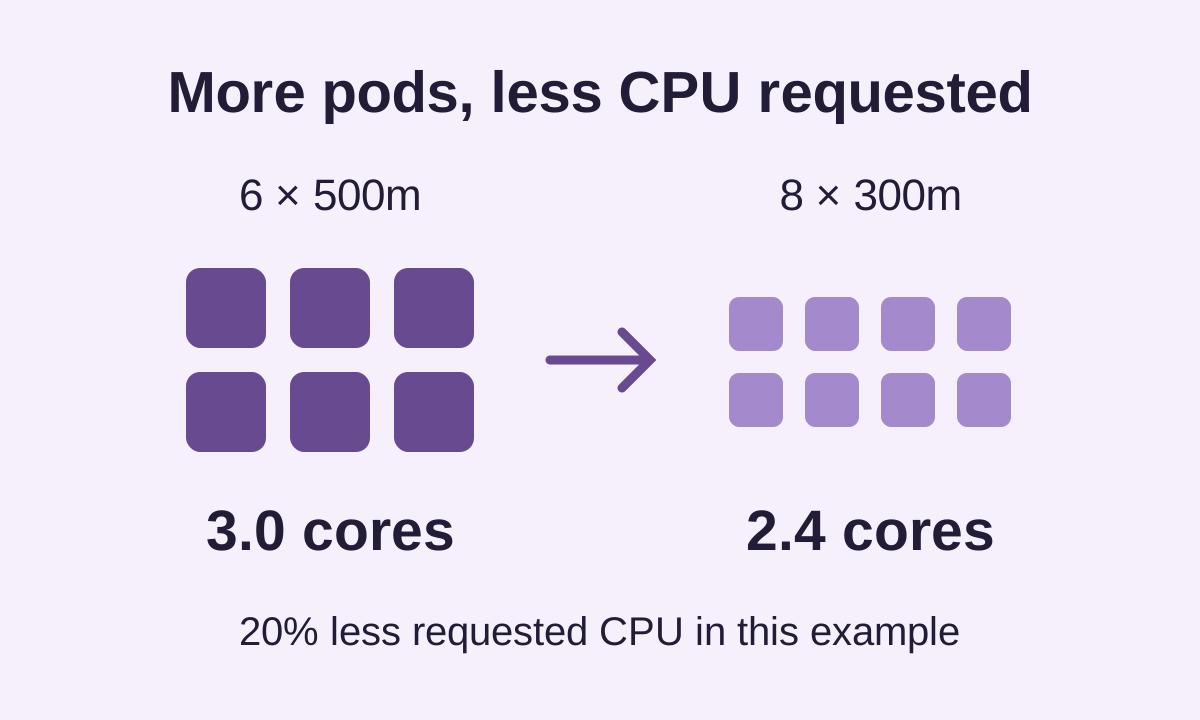
With six ready replicas and a straightforward utilization calculation, the first scale recommendation in the smaller-request case is eight replicas. Actual decisions also depend on tolerance, missing metrics, readiness, and scaling policies. Compare requests, replicas, and node capacity together. If replica count rises, savings can be smaller than the per-pod change suggests.
Test one change against a comparable load
Start with a small canary or replay representative traffic in a test environment. Keep the CPU limit and memory configuration fixed when testing the CPU request. Track p95 or p99 latency, error rate, throttling, restarts, and replica count. Include a traffic burst and a restart so the test covers startup and scale-out.
Set rollback thresholds before the trial. If customer latency breaches its target or the pods fail to stay ready, restore the previous resource settings and inspect the failure before trying a smaller step.
Decide what would count as a successful rollout
Suppose the six original replicas each request 500 millicores, for a total of 3 CPU cores requested. At eight replicas requesting 300 millicores each, the deployment requests 2.4 cores. That is a 20% reduction in requested CPU in this snapshot. The additional replicas still consume memory and may affect where pods can fit.
Use the same traffic window to compare total requested CPU and memory, ready replicas, and how much work completes. If the canary serves a different traffic mix or has a different number of replicas, treat it as a safety check and repeat the capacity comparison under representative load.
Keep the previous configuration ready to restore and note which change you are testing. If you change both requests and the autoscaler target together, you will have a harder time telling which setting drove the result.
Check whether the node pool can shrink
Lower requests can free schedulable capacity without lowering the bill. A node might still be required by availability rules, volume topology, or other workloads. Check whether the freed capacity absorbs new work, avoids a planned node addition, or allows the node pool to scale down.
Record the result over a comparable traffic window. For this API, the useful outcome is fewer paid node-hours or more capacity at the same spend, with latency and reliability within target.