
Reduce tracing costs without losing the failures you need to investigate
Choose head and tail sampling from the evidence your incident responders need, then test routing, late spans, incident bursts, privacy, and the real cost boundary.

The tracing bill is growing, but the next incident still needs evidence
A service team reduces its trace volume and celebrates a smaller observability bill. A week later, an intermittent checkout failure returns. The dashboard shows the error rate, but the team cannot find a useful trace for the affected request. The cost change worked on its own metric while weakening the investigation the tracing system was meant to support.
This guide uses a fictional retail checkout to explore that trade-off. The service receives browser requests, calls inventory and payment dependencies, and publishes asynchronous order work. All traffic quantities and proposed policies are illustrative. They are examples for reasoning and testing, not reported measurements or universal sampling recommendations.
OpenTelemetry describes head and tail sampling as different places to make retention decisions. Head sampling makes an early choice. Tail sampling can use information available later in a trace. The official documentation and collector references explain the supported behavior. The decision process, experiments, and operating checks here are editorial recommendations.
The aim is to spend deliberately on evidence. A good sampling policy helps the team investigate specific failure classes, understand normal behavior, and operate the telemetry pipeline within a known budget. That requires more than choosing a percentage. It requires knowing which questions the retained traces can still answer.
Start with the investigations you need to perform
Ask the on-call team to name three recent questions that traces helped answer. They might include why payment calls timed out, which deployment introduced a slow inventory dependency, and whether a duplicate order originated in the browser or a worker. Those questions establish the evidence worth protecting.
For each question, identify the necessary spans, attributes, timing, and cross-service relationships. A root request span may show total duration without explaining which dependency consumed it. A worker trace may need a propagated context or a useful business correlation identifier to connect asynchronous work. Sampling is only one part of evidence quality.
Separate debugging needs from aggregate monitoring. Request counts and error rates often belong in metrics designed for those purposes. A selectively retained set of traces can be excellent for examples while being a poor basis for estimating the prevalence of a condition without accounting for the sampling method.
Write a short evidence goal before changing retention. For the checkout example, the team wants representative normal traces, useful samples of slow requests, and retained evidence for designated failure types. Those goals will conflict when volume spikes. Naming them makes the later budget decision explicit.
Know where the cost enters the pipeline
Map the path from application instrumentation through exporters, collectors, network transfer, and the storage or analysis backend. Dropping data near the end can reduce storage ingestion while leaving earlier collection and processing costs largely unchanged. The location of the decision affects both savings and failure modes.
Measure the units the backend actually charges for. Depending on the product and configuration, spans, bytes, indexed attributes, retained days, or provisioned capacity may matter. Use the current vendor documentation and your bill rather than assuming every trace has a fixed price. A short trace with large attributes can differ from a longer trace with small records.
Include the collector's own resource use. Tail decisions may require buffering trace data, maintaining state, and coordinating where spans arrive. A lower backend bill can be offset by an overloaded collection tier or reduced reliability if the design ignores those costs.
For a baseline, record input spans, exported spans, approximate payload volume, collector resources, and backend charges over a representative period. Connect each measurement to the pipeline stage it describes. That gives the team a way to explain why a policy change did or did not affect the expected part of the bill.
Understand an early sampling decision
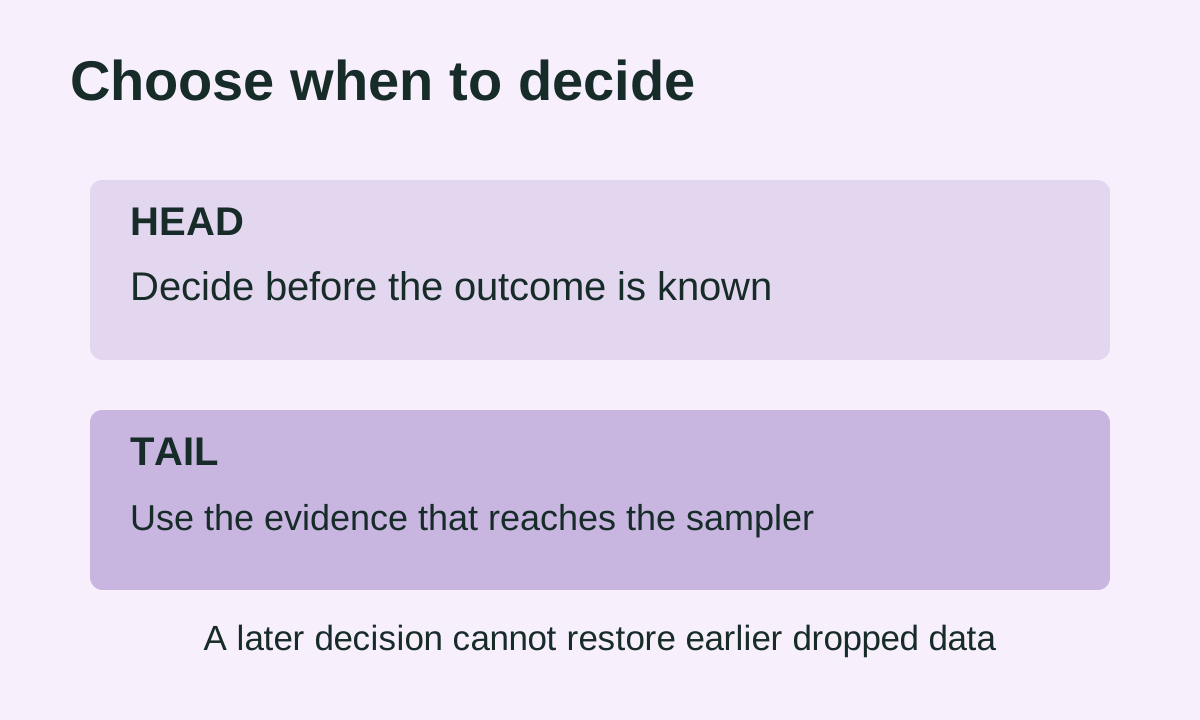
Head sampling decides early whether a trace should be recorded or sampled according to the configured behavior. It can be efficient because the decision is available before the full request has completed. A probability-based choice can provide a spread of traffic when implemented and propagated consistently.
The limitation follows from timing. At the start of a request, the system may not yet know that a downstream payment call will fail or that total duration will exceed an important threshold. A head decision cannot generally use future information that has not happened yet.
For the fictional checkout, an early ten-percent example would mean retaining only a portion of eligible requests according to the chosen sampler. That is an illustrative setting, not a recommendation. The useful question is whether the resulting evidence still supports the team's known investigations under normal and incident traffic.
Test propagation across services. A root service and a downstream service that make incompatible decisions can produce confusing fragments. Use the supported OpenTelemetry sampler and context-propagation configuration for your language and architecture, then inspect representative traces rather than assuming that a successful exporter configuration guarantees a coherent end-to-end result.
Understand a later sampling decision
Tail sampling can inspect information collected during a trace before deciding whether to retain it. That can support policies based on observed errors, latency, or selected attributes. The collector still needs enough of the trace to evaluate the policy, so data collection and routing before that decision remain important.
A later decision is not unlimited hindsight. The system needs a waiting strategy for spans that arrive at different times. Long-running or asynchronous work can complicate that boundary. A span arriving after a decision may not fit the operator's intuitive picture of one complete trace.
For checkout, the team might propose retaining traces that contain a designated payment failure or exceed a tested latency threshold. Those policies should be validated against the actual instrumentation. A status field that is never set correctly cannot support a reliable error-retention rule.
Review the specific tail-sampling processor version and configuration. Policy types, limits, late-span handling, and composition behavior are implementation details that can change. Keep the deployed configuration and component version with the test evidence so a future maintainer can reproduce the result.
processors:
  tail_sampling:
    decision_wait: 10s
    policies:
      - name: observed-errors
        type: status_code
        status_code:
          status_codes: [ERROR]
      - name: observed-slow-traces
        type: latency
        latency:
          threshold_ms: 1000
Illustrative processor fragment, not a complete Collector configuration. The waiting window and latency threshold are test inputs, not recommended defaults. Confirm behavior for the deployed processor version and configure trace routing and the pipeline separately.
Do not expect a later stage to recover earlier losses
If a head sampler drops a trace before it reaches the tail-sampling pipeline, the later policy cannot reconstruct the missing spans. Combining the techniques can be useful, but the combination must reflect what information survives the first decision.
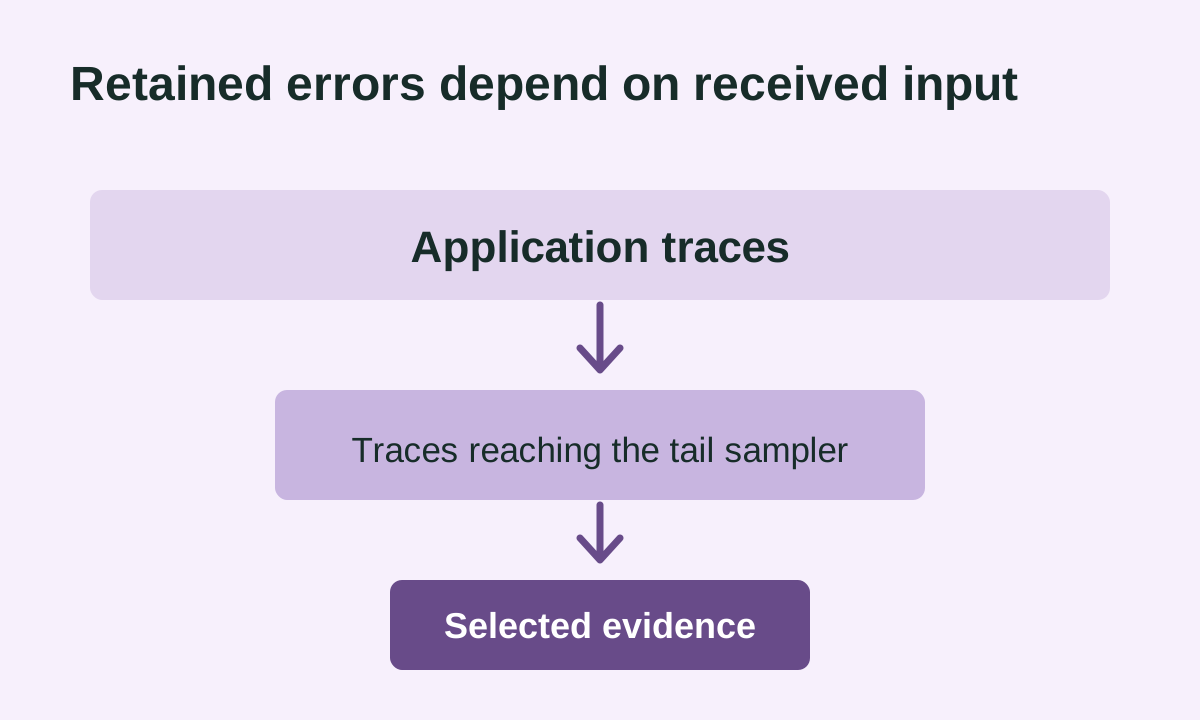
Suppose an illustrative head policy keeps one quarter of requests. A tail rule that retains all observed payment errors can only act on payment-error traces that arrived. It does not mean all payment errors across the service were preserved. The word observed matters when explaining the resulting evidence to incident responders.
Use a simple test to make the boundary visible. Generate a small, labeled set of sandbox requests with known outcomes. Record which requests were sampled early, which reached the collector, and which were retained at the end. Compare the retained trace identifiers with the original set.
Document the coverage honestly. A policy can preserve all errors within its received input while still providing partial coverage of the application. That may be an acceptable budget trade-off, but it should be a conscious decision with a corresponding investigation strategy.
Give normal traffic a place in the policy
Error and latency traces are valuable, but normal traffic provides context. An investigator may need to compare a failed request with a successful request that used the same route, deployment, or dependency. Retaining only exceptional cases can make that comparison difficult.
Choose a baseline sample that reflects the questions the team asks. A broad probability sample, a route-aware policy, or another supported strategy may fit, depending on the pipeline. Avoid creating a special retention rule for every dashboard label without understanding the resulting volume and maintenance burden.
For checkout, include successful purchases, declined payments that are expected business outcomes, and browsing requests that never attempt payment. These are different states. A business decline should not automatically be treated as an application failure simply because it produces an unhappy customer journey.
Test whether the baseline gives enough useful examples during quiet periods. A setting that produces abundant evidence at peak traffic may leave a low-volume administrative route nearly invisible. The answer may be a narrowly scoped policy for that route, a different diagnostic tool, or a documented limitation.
Define what an error means in your application
A technical error flag and a business failure are not always the same. A payment provider can correctly decline a card while the application handles the response as designed. An inventory service can return an expected unavailable state. A timeout or unhandled exception may require a different investigation path.
Review instrumentation with the application owner before writing an error-retention rule. Determine which spans set status, which attributes describe business outcomes, and which values are safe and stable enough for policy use. Avoid relying on free-form error messages that change frequently or contain sensitive content.
Build a small set of labeled examples. Include an expected decline, a dependency timeout, an application exception, and a successful checkout. Inspect the emitted spans and compare them with the policy's intended classification. This turns an abstract rule into a concrete contract between application instrumentation and telemetry processing.
Keep that contract with the service's tests or operating documentation. A later instrumentation update can change status behavior without changing the collector configuration. If the sampling policy depends on those fields, review the change as part of observability behavior rather than treating it as a cosmetic logging update.
Use latency thresholds that reflect a reader's question
A single duration threshold across every route can over-retain naturally slow work and miss significant regressions in a normally fast operation. A report export and a payment authorization may have different expectations. Choose thresholds with the service's user journeys and diagnostic needs in mind.
Start by observing representative latency distributions and route behavior. Then define a bounded set of policy classes the team can explain. Too many narrowly tuned rules can become difficult to maintain, especially when route names or span attributes change across releases.
For the checkout example, a slow payment-related request may deserve retention because it helps distinguish provider delay from local processing. A deliberately long report job might need a separate policy. The exact thresholds should come from measured service behavior and agreed objectives, not an example number copied from another article.
Review the policy after an incident and after substantial workload changes. A threshold that once identified rare slowness can become an expensive default if a dependency degrades continuously. The team needs to decide whether to increase capacity, adjust retention, or accept a temporary diagnostic cost.
Route the spans needed for one decision together
Tail sampling needs a coherent view of the trace data used by its policy. In a distributed collection tier, sending related spans to unrelated decision workers can produce incomplete decisions. OpenTelemetry's scaling guidance discusses the importance of appropriate routing for stateful components.
Map how trace identifiers move through load balancers and collectors. A generic round-robin design may distribute spans from one trace across several workers. The right routing arrangement depends on your topology and supported components, so validate the deployed path rather than assuming that all collectors are interchangeable stateless receivers.
Test with a trace containing several services and deliberately staggered spans. Inspect whether the decision worker receives the required evidence and whether the exported trace contains the expected relationships. Include a collector restart or scaling event in a later rehearsal, because steady-state routing can hide recovery behavior.
Keep operational ownership clear. The application team controls instrumentation and propagation. The platform team may control routing and collector state. Both need access to a shared example trace and a reproducible test when an expected error trace disappears.
Budget the waiting window
A tail sampler needs time to receive enough spans for a decision. A short window can reduce buffering while missing late information. A longer window may improve some evidence coverage while increasing resource needs and delaying export. Choose a window based on observed arrival behavior and the processor's documented semantics.
Do not equate request duration with span arrival time. Export batching, network delays, retries, and asynchronous processing can change when spans reach the decision point. Measure the distribution that matters to the pipeline rather than copying the application's response-time objective.
For checkout, compare a quick synchronous request with a worker that finishes later. Decide whether they should be one trace, linked traces, or separately investigated work according to your tracing design. A very long trace may impose a poor fit on a sampler intended for short request lifecycles.
Test a late span explicitly. Record the decision time, exported trace state, and processor behavior under the deployed version. Document what an investigator should expect. A clearly understood partial-evidence boundary is more useful than a promise that every trace is complete regardless of arrival timing.
Protect the collector during an incident
An incident can increase error volume, retry volume, and span size at the same time. A policy that retains all designated errors may suddenly export much more data than it does during healthy operation. The collector and backend need a tested response to that condition.
Monitor resource pressure, refused or dropped telemetry, export failures, and queue behavior using the components' supported metrics. Interpret those signals alongside application traffic. A sampling policy can look inexpensive because the collection tier is failing to receive or export data, which is not the intended optimization.
Define an incident-mode decision with an owner. The team may temporarily fund higher retention, narrow a noisy policy, or preserve specific critical routes. Avoid an unreviewed emergency change that removes the evidence needed to understand the outage. Record what changed and how it affected coverage.
Rehearse a bounded error burst in a test environment. Observe whether normal traces still have a useful baseline and whether the pipeline recovers after the burst. The cost model should include degraded operating conditions, not just a quiet-day average.
Keep sensitive data out of the retention decision where possible
Trace attributes can contain identifiers, request details, and operational context. A sampling policy does not remove the need to decide what should be collected in the first place. Retaining a smaller fraction of sensitive data still leaves sensitive data in the pipeline.
Review which attributes are necessary for the investigation and whether a less revealing value can serve the same purpose. A route template may be more useful and safer than a full URL containing personal query parameters. An outcome category may be enough without recording a raw provider response.
Consider the stage at which data is removed or transformed. If sensitive content travels through exporters and collectors before being dropped at the backend, it has already crossed those earlier boundaries. Use the appropriate instrumentation and processing controls for your system and verify the actual emitted records.
Include access and retention review in the cost project. Reducing unnecessary attributes can improve both data handling and payload volume, but validate that the remaining evidence still supports real incident questions. A useful optimization removes waste deliberately while preserving the context the team has agreed to need.
Estimate a policy with trace examples
Before broad rollout, collect a small, authorized test set with known outcomes and inspect how each proposed rule treats it. Include ordinary traffic, slow requests, technical errors, expected business declines, and a route with sparse volume. Keep the examples sanitized and stable enough to repeat.
Create a decision ledger for each trace. Record the intended classification, the fields present, the rule that matched, and whether the trace was exported. This reveals mismatches between policy language and actual telemetry. It also gives reviewers an understandable artifact beyond a large configuration file.
Use arithmetic only as an estimate. If an illustrative workload produces one hundred thousand traces, a baseline sample and an error policy can overlap. Do not simply add their percentages unless the policy's composition and the population relationship justify that calculation.
Validate the result against the deployed processor's documented behavior. A policy order, composite rule, or rate limit can change what survives. The final prediction should be tied to a specific configuration and test set, with unknown behavior called out before production rollout.
Use a shadow comparison before cutting retention
A shadow comparison can help evaluate what a proposed policy would keep without immediately removing the team's existing evidence. The exact implementation depends on your telemetry architecture and budget. Use a bounded environment or sample so the comparison itself does not create uncontrolled duplicate ingestion.
Compare the retained examples against known incident questions. Ask an on-call engineer to investigate a synthetic failure using only the candidate evidence set. Can they identify the failing dependency and relevant deployment? Can they compare it with a successful request? Where do they need information the policy removed?
Measure the pipeline's resource needs and backend volume during the comparison. An optimization that looks good on trace counts may have a smaller effect on billable bytes or indexed data. Keep the charge model and the observed output in the same review.
End the comparison with a concrete decision. Keep the candidate, revise specific rules, or reject it because it weakens an important investigation. A lower volume is a useful result only when the service can still answer the questions it agreed to preserve.
Roll out one policy change at a time
Choose a service or traffic slice with clear ownership for the first rollout. Keep the previous collector configuration and a supported rollback method. Avoid changing instrumentation, routing, sampling, and retention duration simultaneously unless the team has a strong reason and an adequate validation plan.
Record the expected effect before deployment. For example, the team may expect a reduction in exported normal traces while designated timeout evidence remains available. Use that statement to choose the post-change checks. A vague goal such as lower tracing cost makes it difficult to identify an unintended coverage loss.
Observe both application and telemetry health after rollout. Sampling should not become a hidden source of resource pressure in the application or collector. Inspect export behavior, collector memory, backend ingestion, and representative traces from the affected service.
Keep the first review window long enough to include relevant workload variation. A successful hour during quiet traffic does not establish how the policy behaves during the daily batch or an error burst. The window should follow the service's operating pattern, with a named person responsible for reviewing the evidence.
Diagnose a missing trace systematically
When a request has no useful trace, start by asking whether the application produced the expected spans. Then inspect propagation, early sampling, exporter delivery, collector receipt, routing, tail decision, and backend ingestion. Each boundary can remove or fragment evidence for a different reason.
Use a stable test identifier or trace identifier where available. Avoid changing several layers while trying to find one missing request. A controlled sandbox request with a known outcome is often easier to follow than a production query assembled from vague timestamps.
Check policy-dependent attributes directly. If the error rule expects a field the application no longer emits, the sampler may be behaving consistently with its configuration. The fix may belong in instrumentation or policy, but the team should understand the mismatch before broadening retention indiscriminately.
Record the failed boundary and update the regression examples. A missing-trace incident should improve the team's ability to distinguish collection failure from an intentional sampling decision. That operational clarity is part of the value of the optimization project.
Avoid treating selected traces as an unbiased census
A retained set that favors slow or failed requests describes those requests well, but it does not necessarily describe the full traffic population. An investigator can use it to find examples of a failure without assuming that the fraction of retained traces with that failure equals the service's true error rate.
Use metrics designed for aggregate measurement when reporting request counts, availability, or latency objectives. If your analysis uses sampled traces quantitatively, understand the sampler's probabilities, weighting support, and backend behavior. The correct interpretation depends on the complete measurement system.
For the checkout dashboard, keep the service error-rate metric separate from a list of retained error traces. The first answers how often the service failed according to its measurement definition. The second provides evidence about selected failures. Linking them is useful, but substituting one for the other can mislead a review.
Explain that distinction to product and finance stakeholders. A smaller trace set can improve cost while preserving useful investigation examples, but it may change which population-level claims are defensible. The operating agreement should say what the retained data is intended to prove.
Review the policy when the application changes
New routes, span names, deployment attributes, and asynchronous workflows can invalidate sampling assumptions. Include observability review in changes that affect the fields or timing your policy uses. A collector configuration can remain syntactically valid while becoming less useful after an application release.
Maintain a small set of representative traces for important service journeys. Update them when the contract changes and rerun the classification checks. The purpose is to catch semantic drift, such as a renamed outcome field, before the next incident exposes missing evidence.
Review low-volume operations separately. A newly added administrative task may not appear often enough in a broad baseline sample for useful debugging. Decide whether it deserves a narrow policy, explicit diagnostic mode, or another form of evidence based on its actual importance.
Retire obsolete rules as well. A policy for a service that no longer exists adds clutter and can accidentally match unrelated data if attribute conventions are reused. Keep ownership, purpose, and the last validation result close to each meaningful rule.
Separate cost savings from incident confidence
Report the financial change in the units the billing system uses, with a comparable traffic window and relevant caveats. Report diagnostic coverage through concrete test outcomes, such as whether the team could investigate designated timeout and dependency-failure scenarios. Those are complementary results.
Do not claim a percentage reduction based solely on a smaller export counter if traffic also fell. Normalize the comparison appropriately and explain the workload mix. A promotional-looking number without a clear denominator can obscure whether the policy improved efficiency at all.
Ask incident responders what changed in their workflow. They may now have fewer normal examples, more targeted error traces, or a longer delay before data appears. Those effects can be acceptable, but they should be understood and reflected in runbooks and expectations.
The final review should identify the retained evidence goals, observed cost effect, known blind spots, and next validation date. This gives the team a maintainable policy rather than a one-time tuning result that nobody can safely revisit.
A tabletop for the next incident
Present the team with a fictional payment timeout that affects a small fraction of requests during a busy hour. Ask which policy should retain the relevant trace, which attributes it needs, and where the spans must arrive for the decision. Follow one labeled request through the full path.
Then remove one assumption. Suppose a downstream span arrives late or the root service used an early sampling policy that excluded the request. Ask what evidence remains and which other telemetry can help. This makes the boundary of the tracing design visible before a real outage.
Finally, introduce an error burst that would match a large share of traffic. Who can authorize a temporary policy change, what cost or capacity signals trigger review, and how will the team restore the normal configuration? A good answer includes ownership and a rollback point.
Capture the discussion as a short operating note. The team should leave knowing what the sampling policy can preserve, what it cannot reconstruct, and how to investigate a suspected gap without blindly raising every retention setting.
Compare two candidate policies in plain language
Suppose the checkout team has two proposals. The first keeps a broad, small sample of all requests. The second keeps a smaller normal baseline plus selected error and slow-request traces. Both can be reasonable, but they answer different evidence questions and may impose different processing costs.
For the first proposal, ask whether rare failures appear often enough to investigate and whether the aggregate sample is interpreted correctly. For the second, ask whether error classification is accurate, whether the collector can hold the required state, and whether the normal baseline remains useful.
Use the same labeled test set to compare them. Include overlapping categories, because a slow request can also fail. Record the rule responsible for retention and the actual exported output. This avoids estimating cost by adding categories that contain many of the same traces.
Choose the policy whose evidence and operating burden fit the service. The decision record should explain the expected trade-off, not merely identify which configuration produced the fewest spans in a single experiment.
Keep a diagnostic escape hatch bounded
Sometimes an investigation needs more detail for a specific service journey. Plan a controlled diagnostic mode before an incident, with a clear scope, owner, duration, and rollback. The mechanism depends on your instrumentation and collector design, so validate what is supported before relying on it.
Avoid accepting arbitrary public input that forces unlimited tracing or exports sensitive attributes. A diagnostic request is an operational capability that can affect cost and data handling. Restrict it according to the service's authorization model and observe its use.
For a sandbox exercise, enable higher retention for one synthetic route or test identity through the approved mechanism. Confirm that the change affects only the intended traffic and that it expires or is removed as planned. Inspect the resulting data for both usefulness and unnecessary fields.
Document how responders request this mode and how they know it ended. A bounded escape hatch can help resolve an unusual failure without turning the normal sampling policy into a permanent collection of overly broad exceptions.
Work through a small retention ledger
Imagine a sanitized test set containing ten trace identifiers. Four are ordinary successful requests, two are expected business declines, two contain technical failures, and two are slow successful requests. The categories are chosen for the exercise and do not represent a measured service distribution.
Write the intended outcome for each identifier before running the candidate policy. A baseline rule may retain some normal and declined requests. Error and latency rules may retain the designated diagnostic examples. The actual result depends on the policy implementation and any early decisions, so record observed output rather than treating the intended ledger as proof.
Now change one trace so it is both slow and failed. Check whether your estimate counts it twice even though only one trace is exported. Then remove the attribute the error rule expects and observe the classification change. These small variations make overlap and instrumentation dependency concrete.
Finally, delay a required span until after the configured decision window in an isolated test. Inspect what the processor retains and what the backend displays. The ledger becomes a compact review tool showing which evidence the policy preserves under normal, overlapping, incomplete, and late-arrival conditions.
Estimate incident volume without promising a bill
Suppose an illustrative service usually produces a small share of technical failures, but a dependency outage causes many requests to match the error-retention rule. The export rate can rise even when the baseline sampling percentage is unchanged. A budget review should include that scenario explicitly.
Start with observed healthy input and payload size, then create bounded incident scenarios using the test environment or approved historical aggregates. Distinguish traces from spans and bytes. A single failing request can contain more diagnostic detail than a normal one, so a simple trace-count multiplier may understate the change in billable volume.
Include the collector resources needed to buffer and decide. The incident can increase incoming data and retained output at the same time. If the team plans a temporary limit, document which evidence may be lost and who can approve the change. That turns an emergency adjustment into an understood trade-off.
Present the result as a range under stated conditions. A cost worksheet should help the team decide how much diagnostic coverage it can support during an outage, not claim that every future incident will match one assumed traffic shape.
Give every rule an owner and a reason
A sampling configuration can accumulate rules the same way an access policy accumulates exceptions. A route is added for one incident, a team requests a temporary attribute match, and an old service name remains after migration. Over time, nobody can explain the complete retention behavior.
Keep a small rule register containing the owner, purpose, expected input, validation examples, and review trigger. The register can live near the configuration and need not be a separate platform. Its value is the explanation that connects a technical condition to a diagnostic need.
When a temporary rule expires, review whether its purpose remains. If the application now emits a better outcome field, replace the fragile condition through a tested change. If the service is gone, remove the dead rule and verify that no unrelated traffic depended on its broad match.
The register also helps during cost review. Instead of asking why the bill rose in the abstract, the team can identify which evidence contracts consume volume and decide which remain worth funding.
Help responders interpret a sparse result
An incident responder who finds only a few traces needs to know whether that scarcity is expected. The runbook should identify the baseline strategy, targeted retention classes, export delay, and known coverage boundaries. This avoids treating every empty search as an instrumentation outage.
Provide a small troubleshooting order. Confirm the time window and service identity, inspect the aggregate metrics, locate a known test trace if available, and check collection health before changing the policy. The sequence should lead to evidence about where data may have been lost.
Explain how to request additional diagnostics through the bounded mechanism the team has approved. The responder should know which owner can change the policy, how long the change lasts, and where its effect is observed. An improvised broad change during an outage can increase cost without answering the original question.
The result is an observability system people can reason about under pressure. Reducing volume is useful when the remaining evidence, its limitations, and the path to investigate a gap are all understandable.
Keep one known request as a diagnostic anchor
Maintain a harmless, authorized test request whose expected spans and outcome are documented. When the team suspects a collection gap, that request can help verify the instrumentation and pipeline path without searching through unrelated customer traffic.
Record which policy should retain it and the conditions under which that expectation applies. A diagnostic anchor is useful only when its route and retention behavior remain current. Review it after instrumentation or collector changes, and keep its data free of secrets and personal information.
Use the result to narrow the investigation. If the known request arrives but the incident trace does not, inspect the incident's classification and timing. If neither arrives, investigate the shared collection path before changing retention percentages.
Start with an evidence contract
Write down the failure classes the team must investigate, the normal traffic context it needs, and the cost boundary it can support. Map those requirements to documented sampling behavior, then test the policy using representative, sanitized requests.
Choose a narrow first rollout and measure both retained usefulness and actual pipeline cost. Include a late-span case, an error burst, and a collector recovery scenario in the validation plan. These exercises reveal more than a healthy-day volume chart.
Keep the application and platform owners involved as the system changes. Sampling is a contract between instrumentation, processing, storage, and the people who use the evidence. The policy stays useful only while those parts continue to agree.
The next practical step is to select one incident question and trace the evidence it requires. A well-chosen sampling policy follows from that question and an observed workload. A percentage chosen in isolation cannot tell you whether the next difficult request will be explainable.